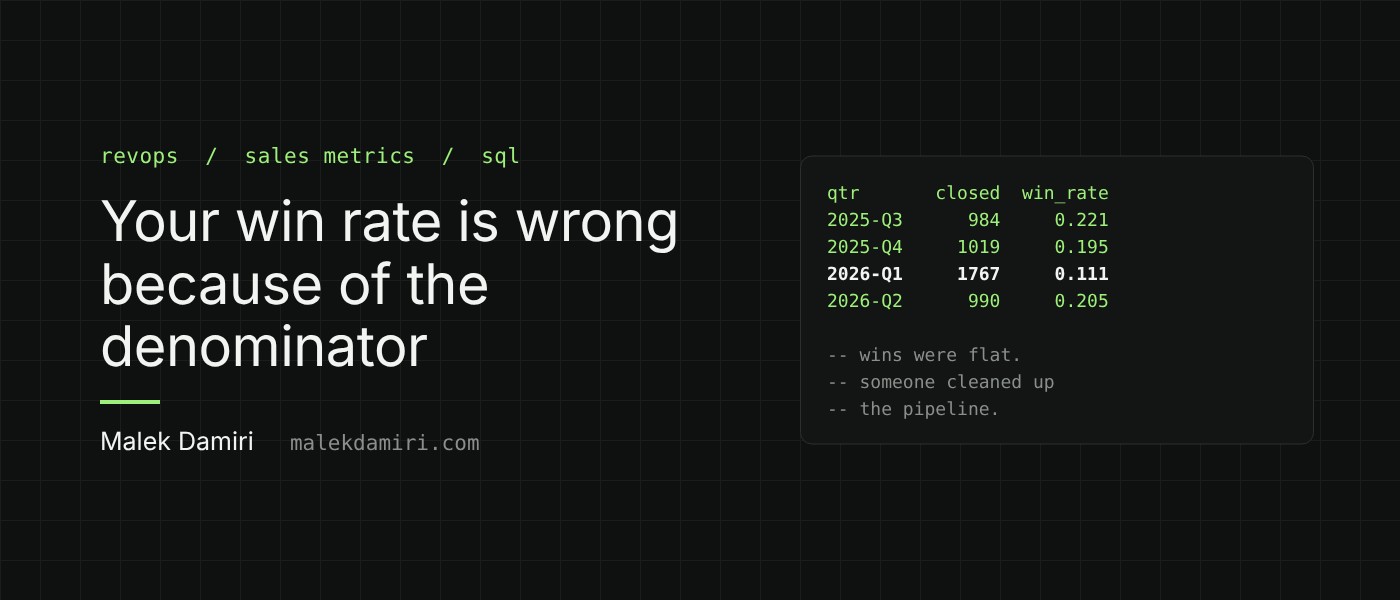
Ask three people in the same company for the win rate and you can get three answers, all calculated correctly, from the same CRM. The numerator is never the argument. Everyone agrees on what a won deal is. The fight is about the denominator: which deals count as a chance you had to win.
That choice can move the number by half. It can also make a quarter look like a disaster when nothing about the sales team changed. Here’s a simulated example, the three common formulas, and the one I’d put in front of a leadership team.
The setup
I simulated two years of opportunities, about 9,000 of them. The rules never change:
- 30% are disqualified on the first call and closed lost within ten days.
- 12% are qualified, then go quiet. Nobody closes them out. They sit open.
- The rest get worked. Each has a 32% chance of being won, with a median cycle of about 60 days.
- On March 31, 2026, someone runs a pipeline cleanup and closes every quiet deal older than 90 days as lost.
The sales team is exactly as good in every quarter. Any movement in the win rate is bookkeeping.
Formula 1: won divided by closed, this quarter
This is the one most dashboards show. Of the deals that closed this quarter, what share were won?
-- 1. The usual one: of the deals that closed this quarter, what share were won?
select date_trunc('quarter', closed) as qtr,
       count(*) filter (where status = 'won') as won,
       count(*) as closed_deals,
       round(count(*) filter (where status = 'won') / count(*), 3) as win_rate
from deals
where status in ('won', 'lost') and closed >= '2025-01-01'
group by 1
order by 1;
       qtr  won  closed_deals  win_rate
2025-01-01  191          1019     0.187
2025-04-01  198           970     0.204
2025-07-01  217           984     0.221
2025-10-01  199          1019     0.195
2026-01-01  196          1767     0.111
2026-04-01  203           990     0.205
Two problems. First, the number is low, around 20%, because a third of the denominator is deals that were never real. Disqualifying a bad lead on the first call is good sales behavior, and this formula punishes it.
Second, look at the first quarter of 2026. The win rate halves. Wins are flat at 196. What changed is that the cleanup dumped hundreds of old, quiet deals into the denominator on a single day. If this number goes in a board deck, someone will spend the next month explaining a collapse that never happened.
Formula 2: only qualified deals
The obvious fix is to drop the deals that were never qualified.
-- 2. Same, but only deals that were ever qualified
select date_trunc('quarter', closed) as qtr,
       round(count(*) filter (where status = 'won') / count(*), 3) as qualified_win_rate
from deals
where status in ('won', 'lost') and qualified and closed >= '2025-01-01'
group by 1
order by 1;
       qtr  qualified_win_rate
2025-01-01               0.292
2025-04-01               0.312
2025-07-01               0.339
2025-10-01               0.298
2026-01-01               0.136
2026-04-01               0.307
Better. The number now reflects deals that someone actually worked. But the cleanup quarter is still broken, and there’s a quieter problem: in every normal quarter, this formula leaves out the deals nobody closed. They aren’t won and they aren’t lost, so they don’t count. A team that never marks anything lost gets a flattering win rate for free.
That’s the real issue with any “closed this quarter” win rate. It measures when someone updated a field, not how deals turned out.
Formula 3: a cohort win rate
The fix is to stop asking what closed this quarter and ask what happened to the deals created in a quarter. Every deal belongs to exactly one cohort, from the day it’s created. It’s in the denominator whether anyone ever closes it or not.
-- 3. Cohort: of the qualified deals created in a quarter, what share were won, and how many are still open?
select date_trunc('quarter', created) as cohort,
       count(*) as deals,
       round(count(*) filter (where status = 'won') / count(*), 3) as won_share,
       round(count(*) filter (where status = 'lost') / count(*), 3) as lost_share,
       round(count(*) filter (where status = 'open') / count(*), 3) as still_open
from deals
where qualified and created >= '2025-01-01'
group by 1
order by 1;
    cohort  deals  won_share  lost_share  still_open
2025-01-01    785      0.247       0.753       0.000
2025-04-01    778      0.274       0.726       0.000
2025-07-01    800      0.258       0.743       0.000
2025-10-01    757      0.256       0.736       0.008
2026-01-01    777      0.245       0.535       0.220
2026-04-01    779      0.086       0.189       0.725
The cleanup has disappeared. Each cohort wins about 25 to 27% of its qualified deals, which is the honest answer: about 83% of qualified deals get worked and 32% of those win. Formula 2 said 30% because it quietly ignored the deals that went nowhere.
The cost is that recent cohorts aren’t finished. The April 2026 cohort shows 8.6% won, but 72% of its deals are still open. That’s not a bad quarter. It’s an unfinished one. So always show the still-open column next to a cohort win rate, and don’t compare a cohort with its predecessors until it’s mostly closed. In this data, that’s about two quarters.
What I’d actually report
Use the cohort win rate as the headline, on qualified deals, for cohorts that are at least 90% closed. It doesn’t move when someone cleans up the CRM, and it counts deals that went quiet as what they are: deals you didn’t win.
Show the still-open share for recent cohorts, so nobody reads an unfinished cohort as a bad one.
Keep the period win rate as an operational number, not a performance one. It’s useful for checking how many deals the team is closing out each week. It’s misleading as a measure of how good the team is.
Write the definition down. “Win rate = won deals divided by qualified deals created in the period, measured once the cohort is 90% closed.” One sentence settles most of the arguments before they start, and it means sales, marketing, and finance all quote the same number.
Watch for the cleanup. If your company does periodic pipeline cleanups, and most do, any metric built on close dates will spike that quarter. Mark the date on the dashboard or, better, stop building performance metrics on close dates.
The general lesson
Most broken ratios in revenue reporting are broken in the denominator. Win rate, conversion rate, churn rate, attainment: each one hides a choice about who was eligible. Before you trust a ratio, ask what’s in the bottom half, and whether something other than performance could change it.