Building multi-Region visualizations with Highcharts in Amazon Quick
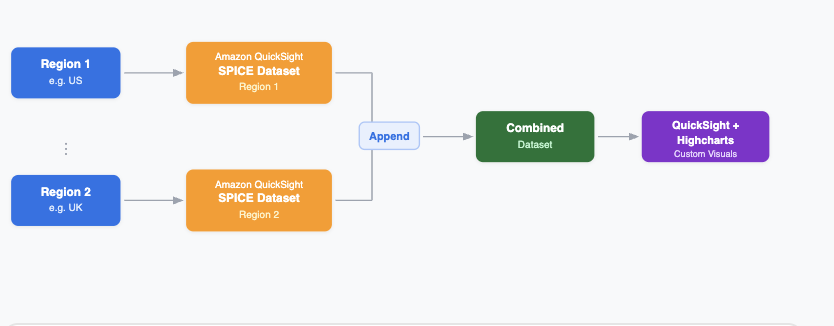
When your carrier performance data spans multiple regions, your dashboard must reconcile fundamentally different competitive structures within a single view. For example, in the US, you rank three carriers (Carrier 1–3) across 49 states and hundreds of metro markets. In the UK, you’re comparing four carriers (Carrier 4–7) across a separate set of national regions. … Read more