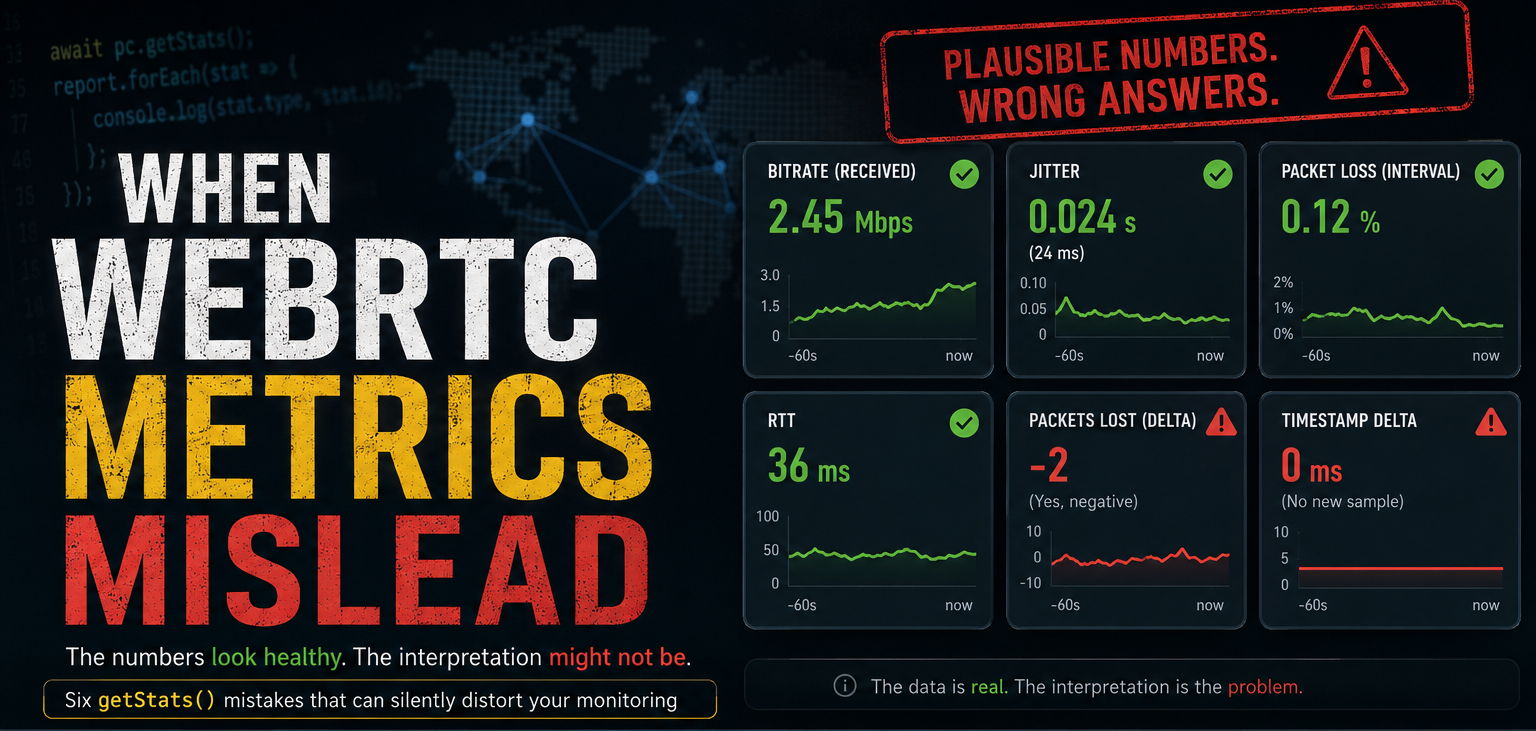
A broken monitoring dashboard is relatively easy to catch. A dashboard showing believable but incorrect numbers is much more dangerous.
That is one of the traps with WebRTC’s getStats() API.
In my work on real-time communication systems, I have used WebRTC statistics to investigate connection quality, recovery behavior, and production reliability. One recurring problem is that a metric can be collected correctly yet still be misinterpreted.
The API exposes detailed information about RTP streams, packet loss, jitter, candidate pairs, codecs, frame processing, round-trip time, and more. But those values do not all behave the same way. Some are cumulative counters. Some are instantaneous measurements. Some depend on information reported by the remote endpoint. Some disappear when the monitored object changes.
If those distinctions are ignored, the calculations can still produce perfectly reasonable-looking numbers.
A bitrate graph keeps moving. Packet loss stays near zero. Jitter looks excellent. Nothing crashes.
The numbers are simply answering a different question from the one you thought you asked.
Here are six mistakes worth checking before trusting a WebRTC monitoring pipeline.
1. Most Values Are Counters, Not Rates
Values such as bytesReceived, packetsReceived, framesDecoded, and nackCount are cumulative counters in the WebRTC Statistics model.
Reading bytesReceived once therefore does not tell you the current bitrate. It tells you how many bytes have accumulated for that stats object.
To calculate a rate, compare two observations:
const bitrate =
  ((curr.bytesReceived - prev.bytesReceived) * 8) /
  ((curr.timestamp - prev.timestamp) / 1000);
The subtraction is straightforward. The details around it are where monitoring implementations often go wrong.
First, use the timestamp associated with the stats object rather than assuming the interval between two calls to your polling function is the measurement interval. A polling loop might execute every second, but that does not mean the underlying measurements represented by two reports are exactly one second apart.
Second, make sure curr and prev describe the same stats object.
That leads to the next problem.
2. The Object You’re Measuring Can Change Underneath You
Suppose a monitoring implementation finds the selected ICE candidate pair in every report and calculates deltas between successive observations.
That works until the selected pair changes.
An ICE restart, for example, can result in candidate-pair objects disappearing and new ones appearing. The replacement object has its own identity and its own counters. The WebRTC Stats specification defines stable identifiers for monitored objects; the important point for a monitoring pipeline is not to treat a replacement object as the continuation of the previous one.
If the monitoring code treats the new object as though it were the next observation of the old one, subtracting the counters can produce nonsense such as a large negative delta.
Match objects by their stats id:
const prevStat = prevReport.get(curr.id);

if (!prevStat) {
  // No baseline exists for this object yet.
  // Store it and wait for another sample.
  return null;
}
A stats ID identifies a particular monitored object. The mistake is not that an object’s ID randomly changes; the object itself can change.
When a previously observed object disappears or a new one appears, treat that as an object transition rather than interpolating across it.
3. Calling getStats() Faster Doesn’t Guarantee Fresher Measurements
It is tempting to assume that calling getStats() more frequently gives you proportionally finer-grained measurements.
That assumption is unsafe.
The WebRTC Stats specification allows implementations to use caching or throttling and does not give applications control over the sampling cadence of every underlying measurement. Two reports obtained from separate calls can therefore contain stats whose timestamps have not advanced.
If you calculate a rate from those observations, your measurement interval may be zero:
const deltaMs = curr.timestamp - prev.timestamp;

if (deltaMs <= 0) {
  return null;
}
Without that guard, the calculation can end in a divide-by-zero. Using the polling loop’s wall-clock interval instead can be worse because unchanged underlying data may still produce a believable rate.
Choose a polling interval appropriate to what you are measuring, but do not use polling frequency as proof that you received a new measurement.
Check the timestamps.

4. jitter Is Measured in Seconds
This one is easy to miss.
For inbound-rtp statistics, jitter is expressed in seconds. Relevant round-trip-time statistics such as currentRoundTripTime are also expressed in seconds in the WebRTC Stats specification.
A value of:
jitter = 0.024
means 24 milliseconds, not 0.024 milliseconds.
Convert deliberately:
const jitterMs = stat.jitter * 1000;
const rttMs = pair.currentRoundTripTime * 1000;
Unit errors are particularly unpleasant in observability systems because the resulting value often does not look broken.
A dashboard showing 0.024 ms of jitter looks exceptional. It is also wrong by a factor of one thousand.
5. packetsLost Is Signed — and Loss Deltas Need Interpretation
packetsLost looks like the kind of counter that should begin at zero and only increase.
It isn’t that simple.
WebRTC defines packetsLost as a signed value following RTP’s cumulative packet-loss semantics. RFC 3550 §6.4.1 defines cumulative loss from the difference between the number of packets expected and the number actually received. Because the received count can include duplicate packets, the cumulative-loss value can be negative.
That means:
const lostDelta =
  curr.packetsLost - prev.packetsLost;
is not guaranteed to produce a positive value.
A negative delta should therefore not automatically be treated as corrupted telemetry.
For interval calculations, you might start with:
const lostDelta =
  curr.packetsLost - prev.packetsLost;

const recvDelta =
  curr.packetsReceived - prev.packetsReceived;
What happens next depends on the metric you want to expose.
A dashboard may intentionally clamp negative interval loss to zero for presentation purposes. If it does, that should be an explicit definition of the dashboard metric rather than an assumption that the underlying WebRTC statistic must be wrong.
There is another trap here: dividing cumulative loss by cumulative received produces a session-level value that becomes progressively less responsive as the session gets longer.
If the question is “what happened during this interval?”, calculate from interval deltas instead.
6. bytesReceived Isn’t Automatically “Media Bitrate”
bytesReceived sounds like an obvious input for a media-throughput graph.
But you need to know what those bytes represent.
For inbound RTP statistics, retransmission and forward-error-correction traffic can contribute to the byte counters exposed by the report. The WebRTC Stats specification defines retransmittedBytesReceived and fecBytesReceived alongside the corresponding RTP statistics.
If the implementation exposes the corresponding fields, you can separate them:
const originalBytes =
  stat.bytesReceived
  - (stat.retransmittedBytesReceived || 0)
  - (stat.fecBytesReceived || 0);
Do not assume those fields will always be available, so handle their absence explicitly.
More importantly, decide what the metric is supposed to answer.
If the question is about total received RTP traffic, including recovery overhead may be appropriate. If the question is about original media data, it may not be.
Both measurements can be useful. Calling both of them simply “bitrate” is where the trouble starts.
One More Trap: Missing Remote Stats Do Not Mean Zero
remote-inbound-rtp is useful because it exposes information about how the remote endpoint sees media you are sending.
Those measurements originate remotely and are communicated back through RTCP reports. The corresponding remote stats therefore do not necessarily exist as soon as the peer connection becomes connected.
Monitoring code often turns missing values into zero because zeros are convenient to store:
const remoteLoss = remote?.packetsLost || 0;
Semantically, that can be wrong.
Before the relevant remote report has arrived, the value is not zero. It is not yet known.
That distinction matters when metrics are aggregated. Treating unavailable measurements as zeros can make the beginning of a session appear artificially healthy and can distort averages across many sessions.
Preserve “unknown” as a state until the measurement actually exists.
The Pattern Underneath All Six
The individual mistakes are different, but most come from the same assumption: that the name of a getStats() field tells you how to use it.
It doesn’t.
framesPerSecond is a gauge.
framesDecoded accumulates.
jitter is measured in seconds.
jitterBufferDelay accumulates over time and becomes useful for average delay when interpreted together with jitterBufferEmittedCount.
Remote measurements may not exist yet. Objects can disappear and be replaced as the connection evolves.
Before putting a WebRTC statistic on a dashboard, answer four questions:
- Is this value cumulative, instantaneous, or derived?
- What unit is it expressed in?
- What object does the value belong to, and am I comparing the same object across reports?
- Can this value legitimately be unavailable?
Those questions are more useful than the field name.
Because the most dangerous WebRTC monitoring failure is rarely a dashboard full of NaNs.
It is a dashboard full of reasonable numbers that are measuring the wrong thing.